How to Use EverSlidePath
A complete walkthrough of the pathology viewer — from loading slides to submitting annotated cases.
Viewer Overview
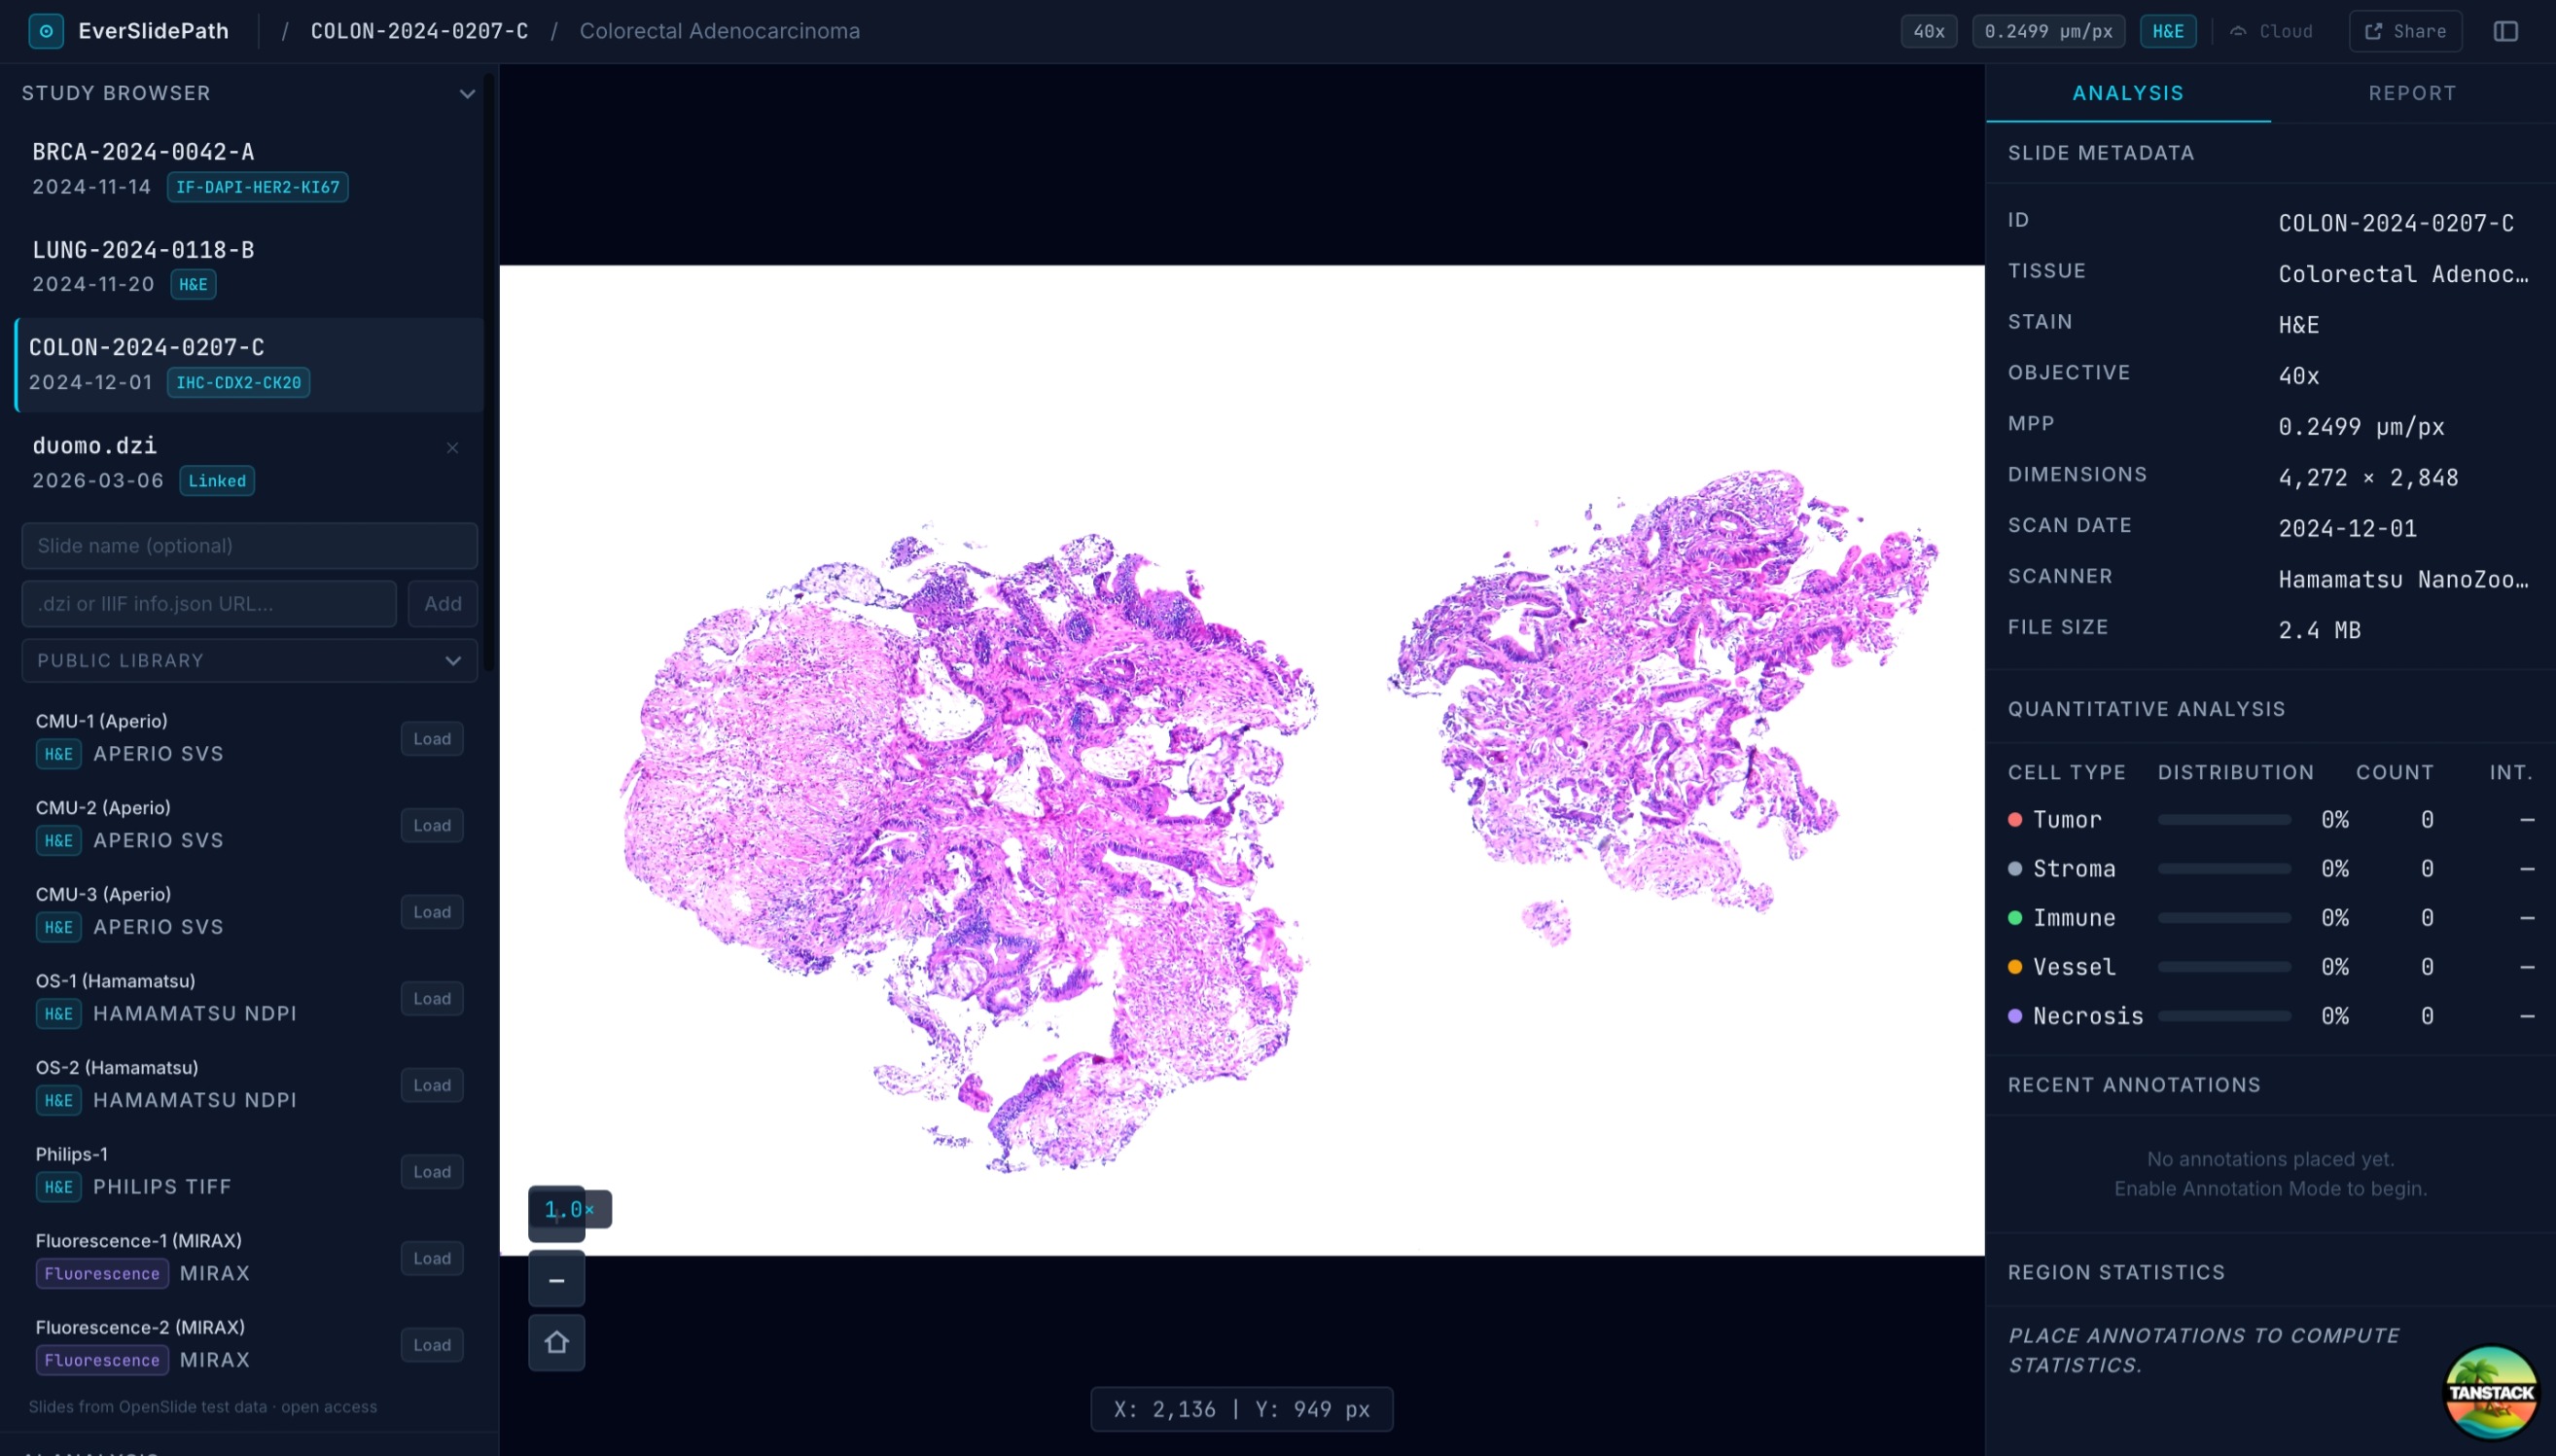
- TopBar — slide metadata (stain, objective, resolution), sync status, share link, and navigation
- Left Sidebar — Study Browser for loading slides, annotation tools, and AI analysis controls
- WSI Canvas — the main whole-slide image viewport with pan, zoom, and overlay rendering
- Right Sidebar — Analysis, Report, and Case tabs for quantitative data and exports
Loading Slides
The Study Browser in the left sidebar gives you three ways to open a slide:
- My Slides — uploads you've added via the URL/DZI input or linked slides
- Public Library — curated reference slides available to all users
- URL / DZI input — paste any publicly accessible DZI manifest URL to load a remote slide instantly
Annotation Tools
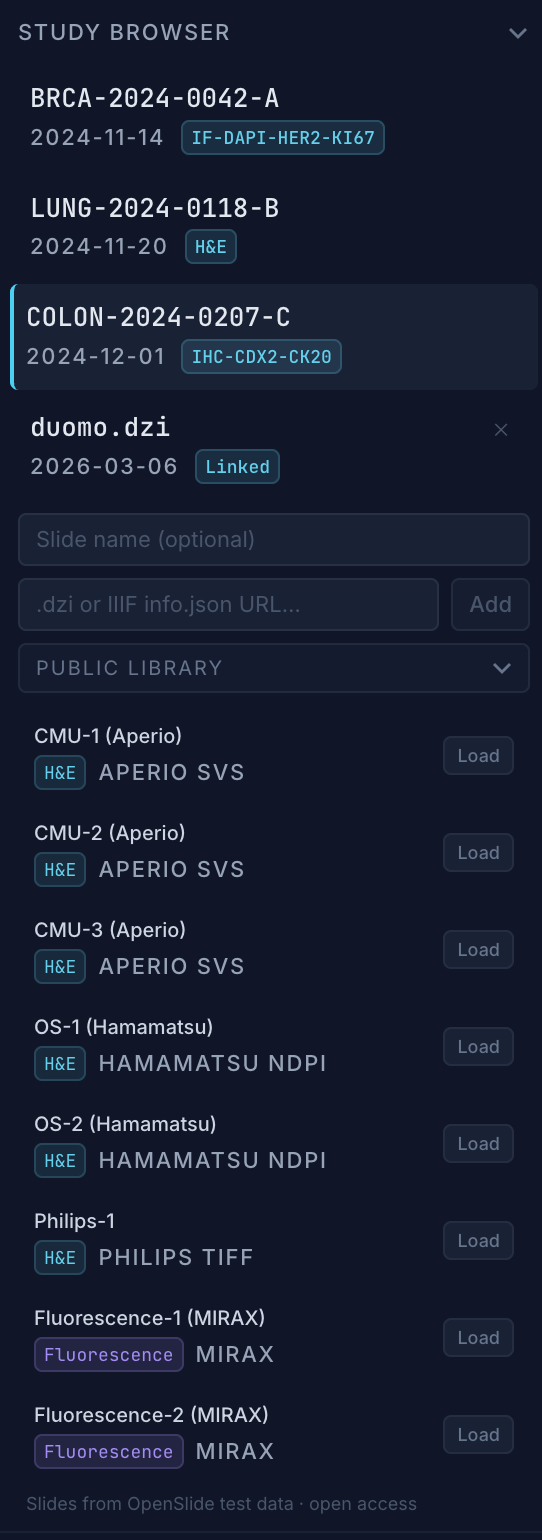
Enable Annotation Mode from the left panel to unlock the full toolset:
- Shape picker — Circle, Square, Pin, Freehand, or Polygon
- Color swatches — assign a color to distinguish annotation categories visually
- Tissue labels — Tumor, Stroma, Immune, Vessel, Necrosis, or a custom name
Click or drag on the canvas to place annotations after selecting a shape.
AI Analysis
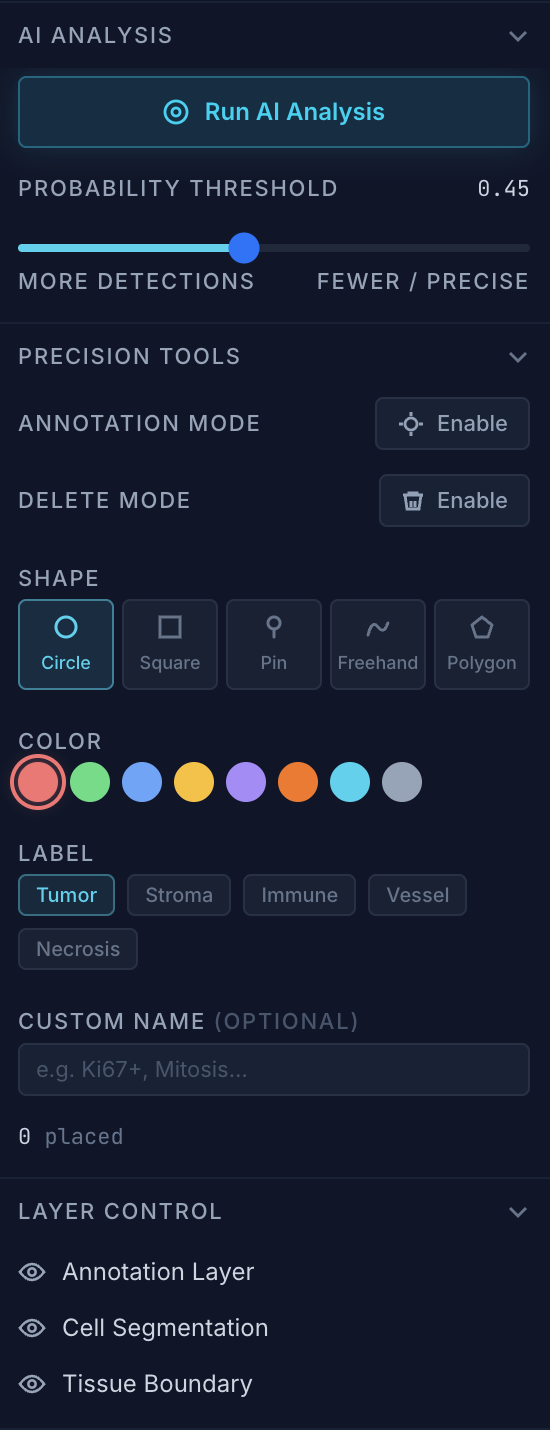
The Run AI Analysis button (left panel, below annotation tools) sends the current viewport region to the detection model. Once complete, probability heatmaps overlay the canvas.
Use the probability threshold slider to filter detections by confidence — drag right to show only high-confidence regions. The model detects mitotic figures, tumor cell clusters, and stromal boundaries depending on the stain protocol.
Tip
AI analysis runs on the current viewport region only. Pan to a new area and run again to analyse the full slide progressively.
Channel Mixer
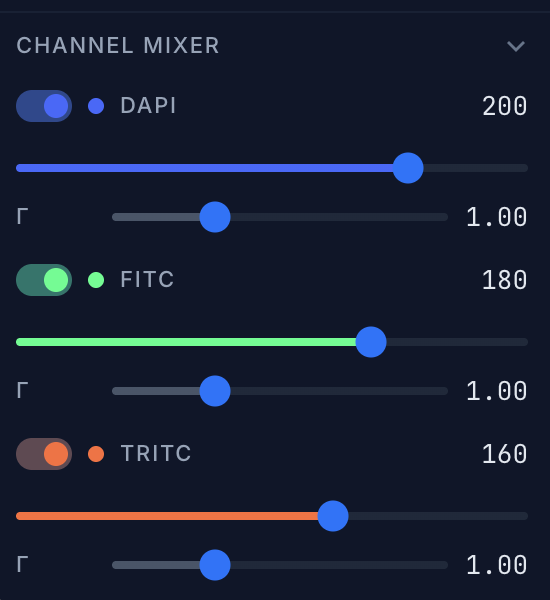
For fluorescence slides (e.g. DAPI/FITC/TRITC stained), the Channel Mixer panel lets you independently control each channel:
- Toggle on/off — isolate individual fluorescence channels
- Wavelength — adjust the excitation wavelength per channel
- Gamma — fine-tune brightness/contrast to bring out specific structures
All changes apply in real-time on the canvas.
Analysis & Report Panels
The right sidebar contains two tabs:
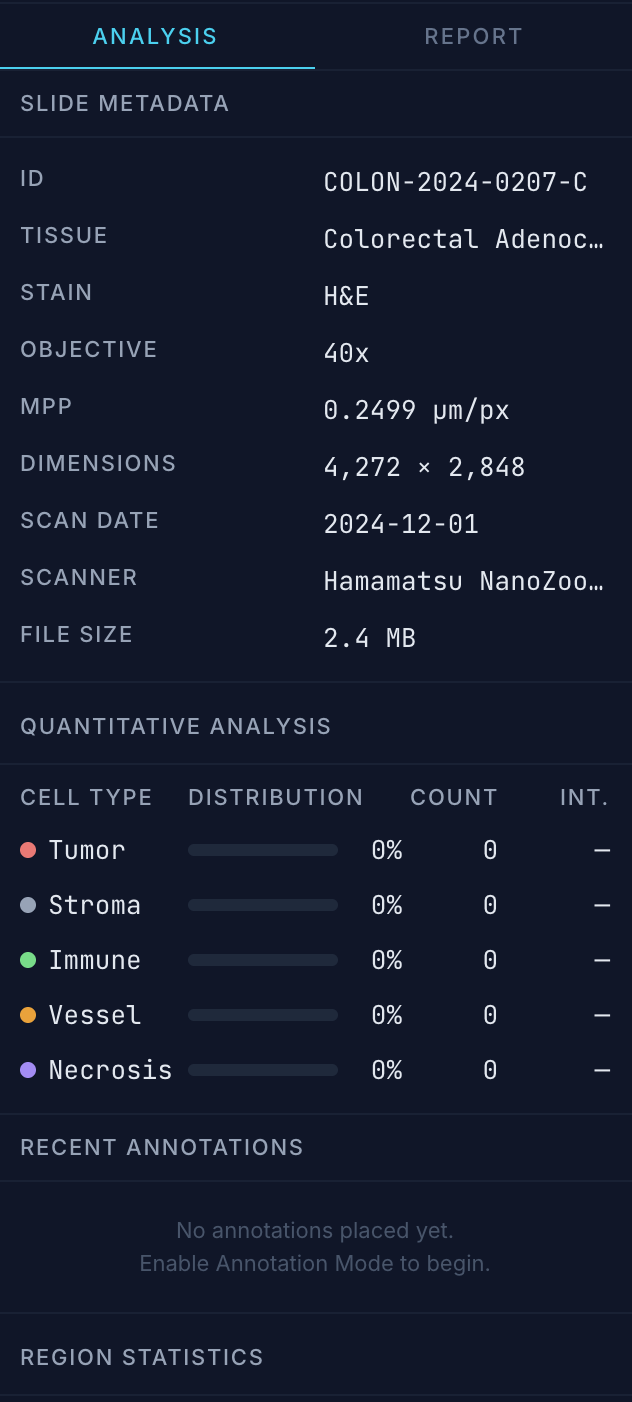
- Analysis tab — slide metadata (scanner, resolution, stain), quantitative breakdown of annotated regions, recent annotation list, and per-region statistics
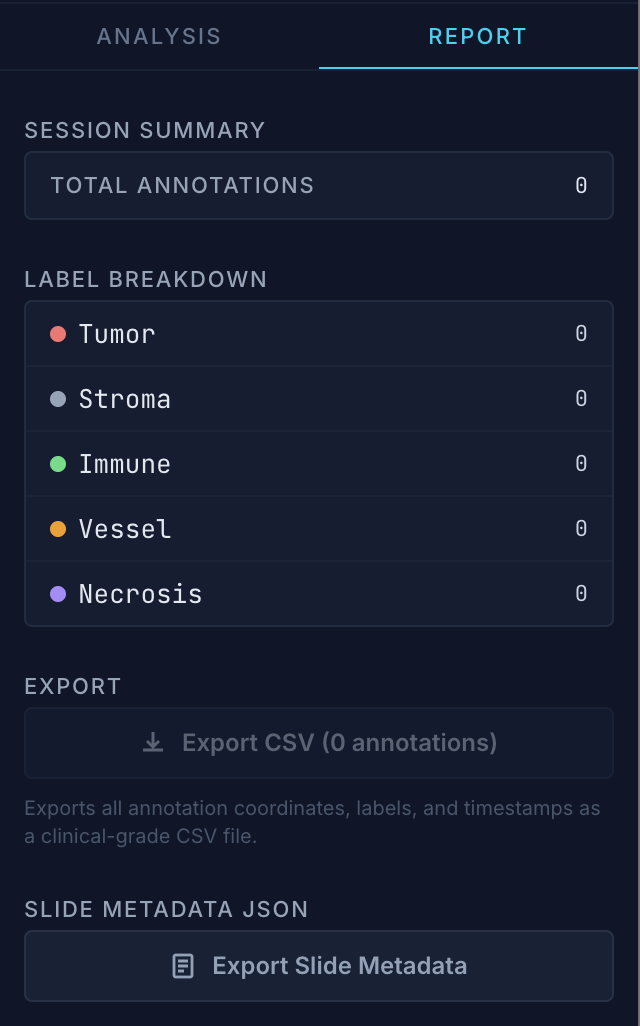
- Report tab — session summary,
Export CSVfor annotation data, andExport JSONfor full metadata including slide parameters
Educational Mode
EverSlidePath includes a structured case-based learning mode for courses and labs.
Students
- Join a class at /join using your class code
- Open assigned cases from your /dashboard
- Annotate the slide and submit when finished
- After submission, annotations lock and the ground-truth overlay becomes available for self-review
Instructors
- Create cases and add ground-truth annotations at /instructor
- Build courses and assign case sets to student groups
- Track submission and annotation progress per student in the instructor dashboard
- Diagnosis and ground truth are revealed to students only after submission
Submit Flow
When a student clicks Submit Case, all annotations lock (no further edits), the instructor's diagnosis is revealed, and the ground-truth annotation overlay becomes available so the student can compare their work against the expert's.